PACK PREMIUM by Pixience, C-Cube Clinique Research Edition
12 October 2023
Available in January 2024
Increase the analysis performance of your C-Cube CR by subscribing to Premium Access. With an annual licence, you’re guaranteed to have the latest version of the software and all its latest innovations. Take advantage of the tool’s new features and unlimited performance.
Unlimited statistical views
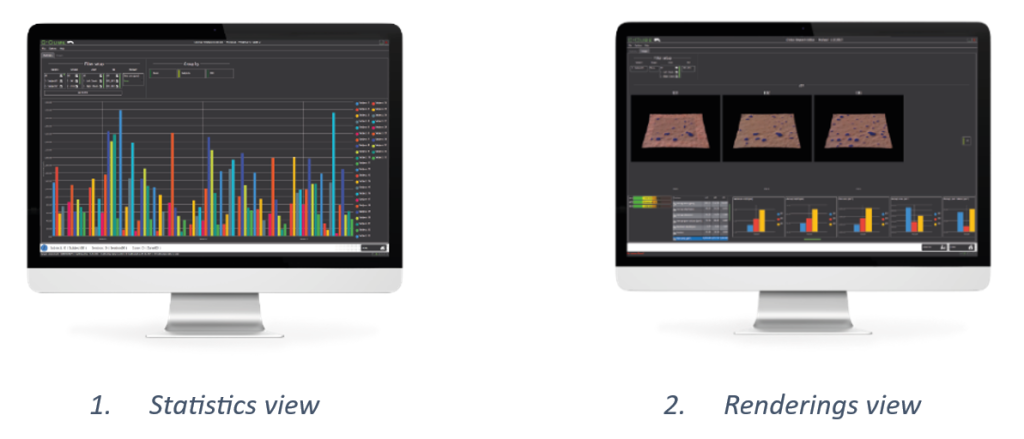
The Premium pack gives you access to two new views:
- The Statistics view lets you view graphical representations of study results by patient, session, zone or ROI.
- The Renderings view helps you to evaluate the effectiveness of treatments thanks to a gallery of renderings by criteria and graphs of analysed data.

Access to the capillary module
Carry out your hair studies using the Tricho-One module. It’s a precise tool for monitoring hair loss and response to treatment. With TRICHO-ONE, all the important parameters of hair growth can now be measured.
The export 3D print
Showcase and reveal the results of your studies from every angle by exporting the 3D volume of your data in a format compatible with the Windows 3D viewer. This 3D rendering can be used by all your teams.

Manage your multi-centric studies
With the premium pack, you can centralise your analyses on a single workstation. By automatically importing and updating your partners’ study files in your analysis workstation, you can start the analysis before your studies are complete.
Profilometric analysis
The new profilometry tool allows you to carry the depth and the volume of wrinkles in your clinical studies.

Unlimited analyses
Perform the analyses for these two criteria on your own:
– Keratin (D-squames or Corneofix patch): Area %, Area (mm²), Desquamation Index
By analysing the intensity levels in the sample area, it is possible to determine a threshold between the “background” (the dark sample area) and the “shape” (the scales). It is easy to distinguish them and measure the relative surface area of scales relating to the total surface area of the patch. As the quantity of flakes is correlated with skin dryness, it is a good indicator of hydration.

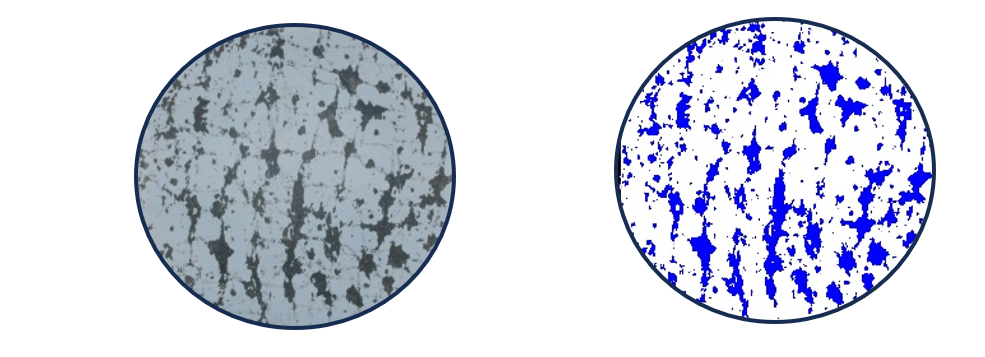
– Sebum (Sebutape or Sebufix patch): Area %, Area (mm²), Score % and Render
The sebum collection area and application time are always the same. The sampling area’s color is light and uniform to clearly distinguish dark patches of sebum. The samples are analysed using the Pixience sample reader and the C-Cube camera. An analysis of the intensity levels in the sampling area allows to determine a threshold between the “background” (grey sampling area) and the “shape” (black sebum patches). We can therefore distinguish them and measure the relative surface area of sebum relating to the total surface area of the patch (expressed as a rate or %).

Access to credit image processing
Thanks to a credit management system, you can analyse more criteria directly in your software:
– Pores (3D)
3D analysis adds a dimension to pore depth. This approach improves the sensitivity of pore detection, while allowing you to assess the depth and possible “filling”. This detection only focuses on pores whose depth is significantly marked in relation to the imaged surface.

– Microprofile (3D)
The isotropy of the microrelief is an indicator of skin ageing and hydration, based on an analysis of the nature of the furrows in the skin. Furrows running in all directions are said to be “isotropic” and indicate young, hydrated skin. Furrows pointing in only one direction are said to be “anisotropic” and indicate older and/or drier skin.

– Radiance (2D)
Radiance measurement is based on the C-Cube camera’s patented illuminant technology and its colour standardisation. This parameter makes it possible to express variations in skin luminosity, redness and homogeneity (in a single criterion). These combined measurements, correlated with sensory measurements of the impression of radiance, make it possible to obtain a radiance index.
– Pollution (2D)
The C-Cube’s calibration enables reliable colour measurements to be taken. This ability, combined with specific automated image analysis, allows pollution particles to be detected and quantified. This analysis produces an image locating the particles detected and a digital measurement of the proportion of skin covered by pollution.

Pixience assists you for all your clinical studies. Click here to visit the C-Cube Clinique Research Edition website.
*publirédactionnel
CONTACT
Pixience
Sébastien Mangeruca
CEO


 Follow us on Linkedin!
You must be logged in to post a comment.